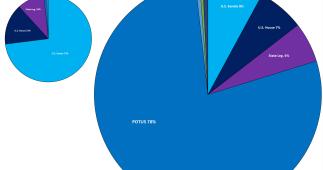
Four years ago, at the end of August 2020, I had raised a total of $1.29 million for Democrats up & down the ballot, broken out as follows;
- U.S. Senate: $940K (73%)
- U.S. House: $197K (15%)
- State Legislature: $130K (10%)
- POTUS: $14.4K (1.1%)
- State Execs (Gov/AG/SoS): $6.9K (0.5%)
- State Supreme Court: n/a (0%)
- Other: n/a (0%)
-
TOTAL: $939,771
So how am I doing as of the end of August this cycle by comparison?
Well, let's just say I'm doing...better.
- U.S. Senate: $673K (7.9%)
- U.S. House: $563K (6.6%)
- State Legislature: $486K (5.7%)
-
POTUS: $6.64 MILLION (78%)
- State Execs (Gov/AG/SoS): $52.2K (0.6%)
- State Supreme Court: $36.9K (0.4%)
- Other:$62.9K (0.7%)
-
TOTAL: $8,516,198
Overall, I've raised 6.6x as much for Democrats so far this cycle as I had at the same point in 2020.
Needless to say, this has completely destroyed my prior 2024 cycle / 2020 cycle comparison graphs.
Here's what they look like side by side...scaled to reflect the massive increase in the overall size of the fundraising pie vs. four years ago:

When I launched my 2024 fundraising project, I was naively hoping to raise perhaps $4 million total, broken out roughly into thirds: 1/3 U.S. Senate races; 1/3 U.S. House races; and 1/3 State Legislative and Statewide Executive races. While I included President Biden on some pages as a courtesy, I was really hoping to focus heavily on down ballot races, especially at the state legislative level.
And until July 21st, that's pretty much where my 2024 cycle fundraising project was headed.
NOW, however...well, POTUS has skyrocketed from making up just 1.1% of my total fundraising this cycle to 78%.
Having said that, there's still great news in nearly every other category as well.
Here's what it looks like in bar graph format. For obvious reasons, I wasn't able to fit the fundraising for VP Harris on the chart; if I had tried, most of the other columns would have been virtually invisible:
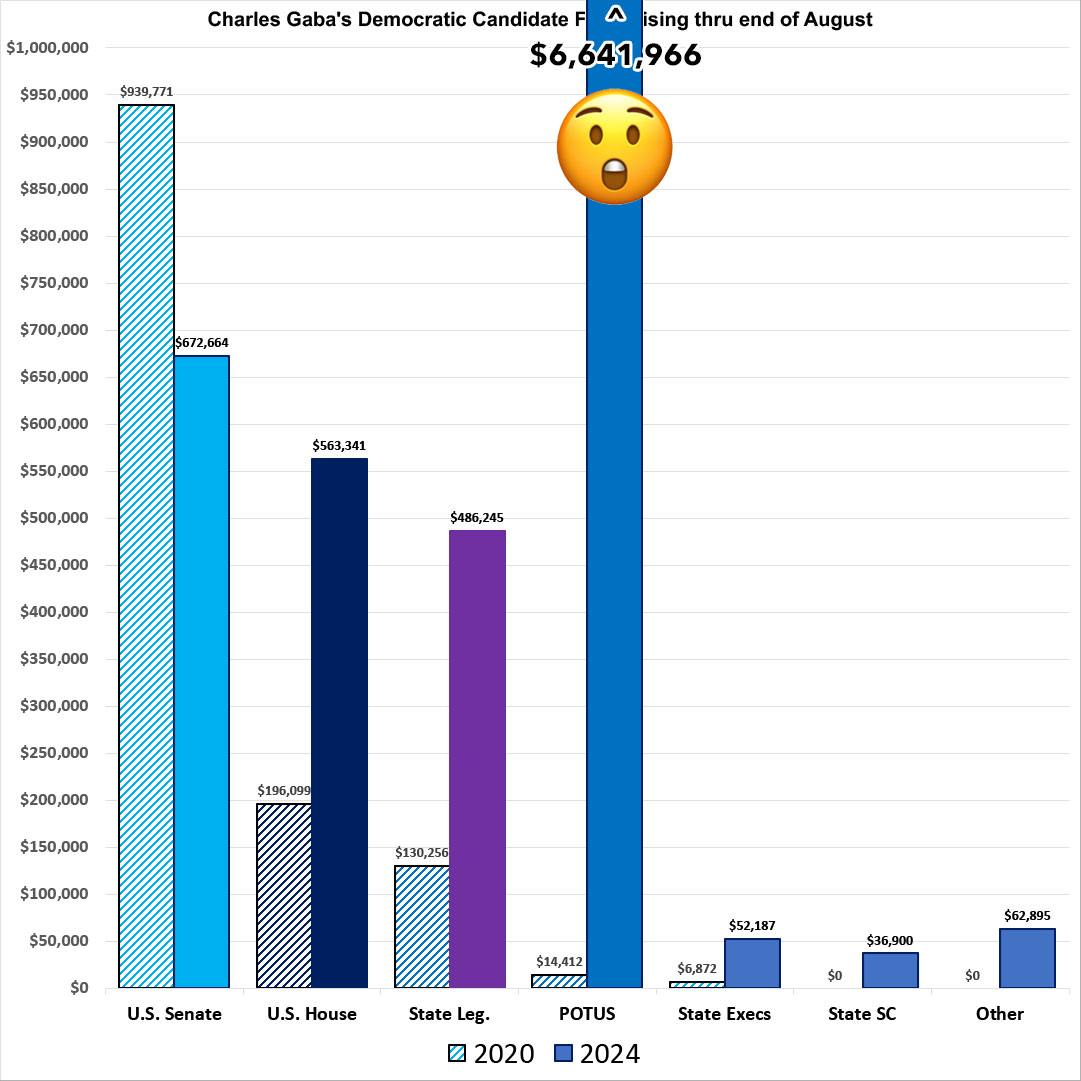
My POTUS fundraising is up a batshit insane 46,000% higher compared to the same point in 2020 ($6.64M vs.$14.4K).
As for the other types of races:
- My U.S. Senate fundraising is the only category where I'm lagging behind the same point in 2020 (down about 28%), however, there's a major caveat toth is; see below.
- My U.S. House fundraising is a different story: It's 2.9x higher than what I had raised at this point last cycle.
- My State Legislative race fundraising is even more impressive: 3.7x higher than the same point in 2020.
My fundraising thru August is also dramatically higher for State Executive and State Supreme Court races, although I didn't really focus much on those in 2020 anyway (and in fact I wasn't raising money for state Supreme Court races at all last cycle).
Finally, I've raised nearly $63,000 for a variety of other assorted organizations, including:
- State & County Democratic Parties
- Voters of Tomorrow
- Reproductive Rights ballot initiative advocacy organizations in Arizona, Florida, Missouri & Montana
- A few other oddball organizations
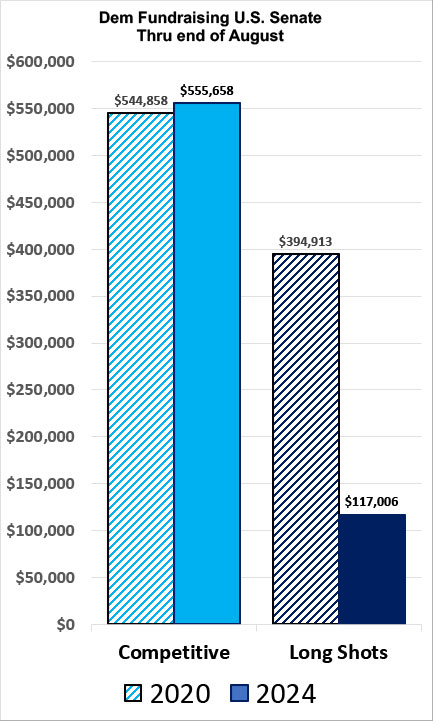
Taking a closer look at the U.S. Senate number: While it's down 28% overall, it's important to break this out between competitive races and long shot seats.
In 2020, there were a dozen Senate races which were generally considered up for grabs: AZ, CO, GA (x2), IA, ME, MI, MN, MT, NH, NM & NC.
There were another 16 Republican-held seats which were basically unflippable by Dems, but which I listed on the fundraising page in order to encourage party building and other reasons.
This year there's 10 Senate seats I consider competitive (or at least potentially competitive): AZ, FL, MD, MI, MT, NV, OH, PA, TX & WI. Florida and Texas are reaches but still in the "competitive" category. I also briefly included Tim Kaine (Virginia) before removing him, and Andy Kim was on the page for awhile earlier this year.
There's another ten GOP seats which are likely pipe dreams but again, you never know: IN, MS, MO, NE*, NE Special, ND, TN, UT, WV & WY.
Thru August 2020, Senate donations were split 58/42 between the Tier 1 and Tier 2 Senate races.
THIS cycle, however, 83% of the Senate funds I've raised have gone to one of the competitive races, with just 17% going to the other ten long shots combined.
As a result, while my total Senate fundraising is down, for COMPETITIVE Senate seats it's actually UP slightly (2%)!
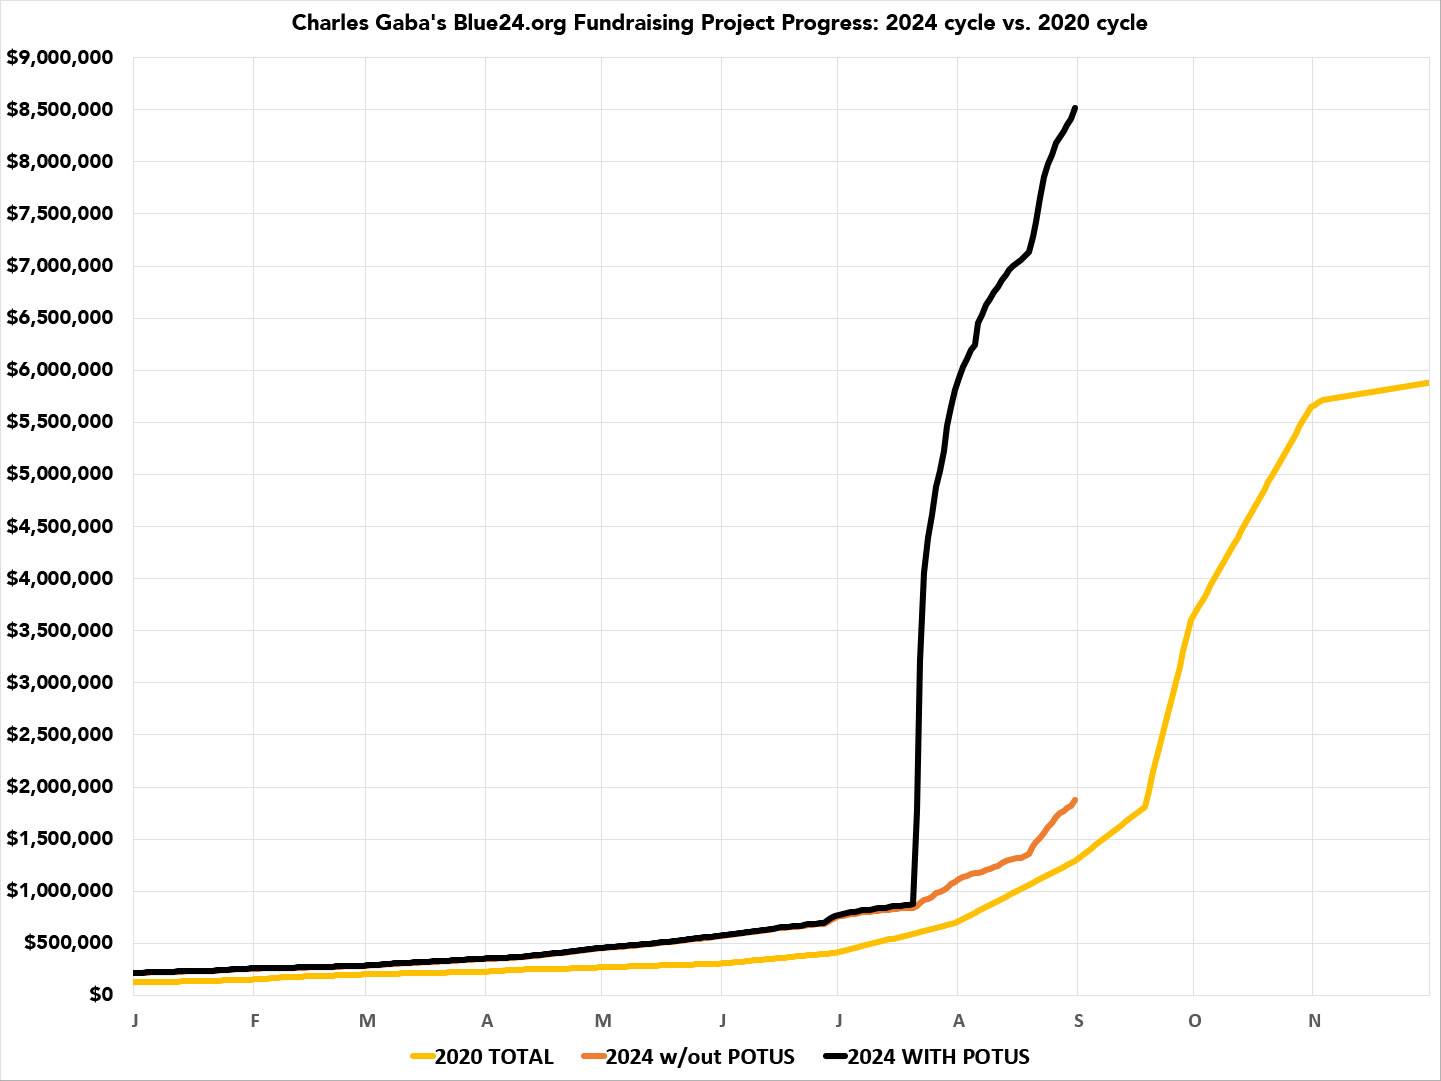
Here's a final graph to help put things into perspective:
The orange line shows how much I raised for Democrats total over the course of 2020. The upward spike in late September was caused by Supreme Court Justice Ruth Bader Ginsburg passing away on Sept. 18, 2020.
The black line shows how my overall fundraising efforts are going this year.
(I've also included a green line showing what my 2024 fundraising looks like without POTUS included...as you can see, it's still well ahead of the same point 4 years ago.)
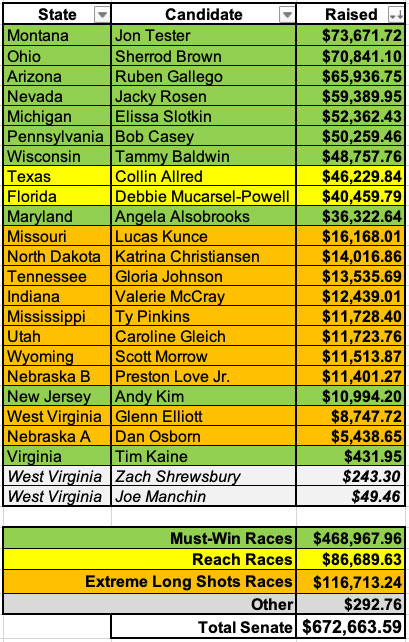
Here's how much I've raised to date for each U.S. Senate candidate. As you can see, the Tier 1 races are well ahead of the Tier 2 ones, with the exceptions of the two which I removed some time ago (Kim & Kaine).
(Joe Manchin & Zach Shrewsbury were both listed very briefly when I thought each of them was going to be the nominee, a mistake on my part).
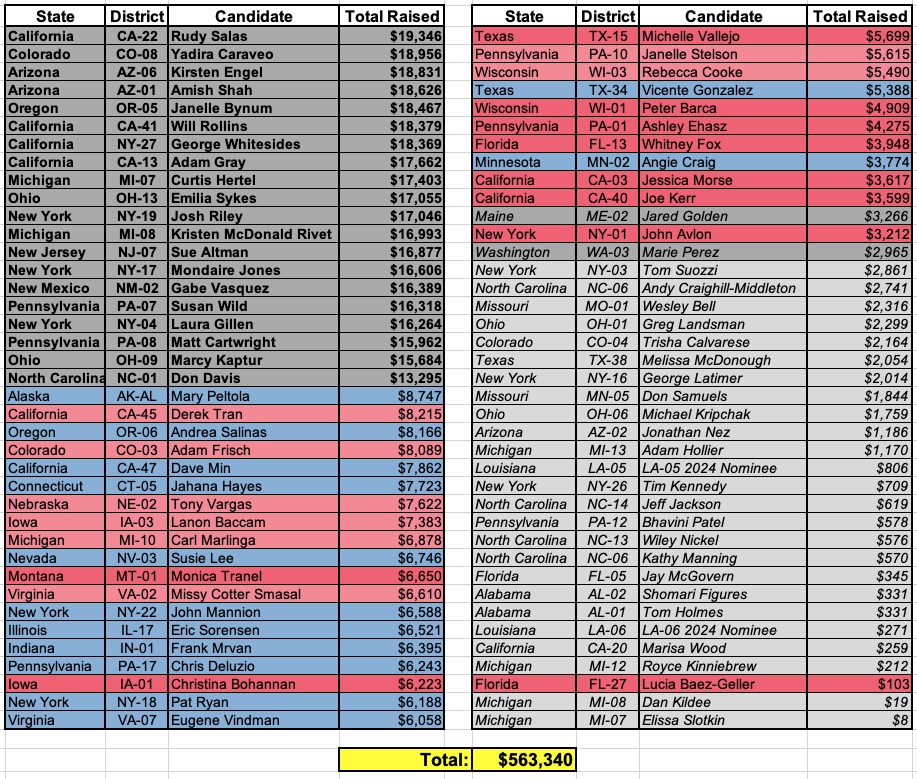
UPDATE: Here's a breakout of what I've raised for every U.S. House Democrat.
Note how 20 of CookPolitical's "Tossup" races are in the top spots. That's by design--My main page has 52 races, my Endgame page has 22.
As for the rest:
- Jared Golden & Perez are also tossups but I just can't in good conscience raise money for them anymore.
- The blue races are rated by Cook as Lean Dem. The light red races are rated as Lean GOP. The red races are rated as Likely GOP.
- Florida's 27th district (Lucia Baez-Geller) was just added a few days ago (I somehow missed it until now)
- The grey races are special elections; primary challenges (2 successful, 2 not); candidates who dropped out, announced retirement or decided to run for higher office; or candidates (AL-01 & AL-02) who went from favorable to unfavorable redistricting.
Here's the breakout of what I've raised for State Legislative Democrats (plus the various Democratic legislative caucus PACs whose sole purpose is to elect state legislative Democrats). The 8 swing states (in green) make up just over half of the total. The grey states are ones which I'm not bothering raising money for at all. I've also noted the states which don't have any general election legislative races this year.
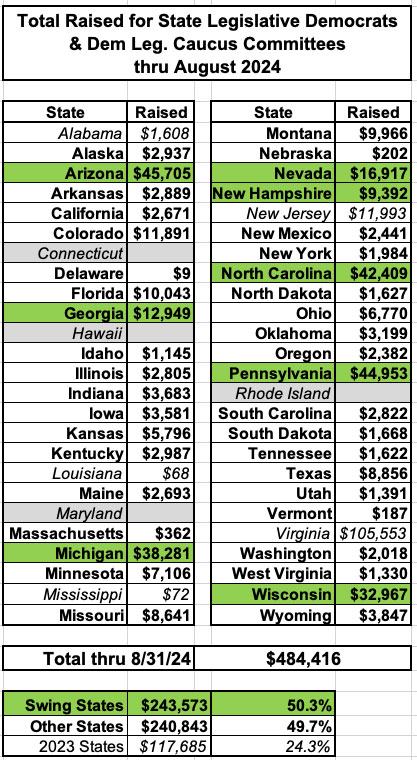
I'm raising money for a total of around ~650 state legislative candidates, so that breaks out to an average of around $750 apiece so far.
Next, let's look at what links are driving the donations. This is an imprecise estimate since I sometimes forget to include the refcode tag when I post the links on social media, but it should at least provide some idea of how effective different outlets are:
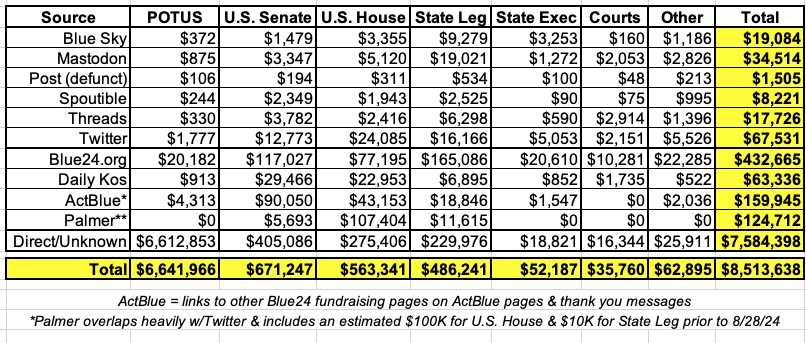
I want to give a special shoutout to Bill Palmer of Palmer Report, who has been promoting the heck out of my "Endgame" fundraising links for the past week or so to his 500K+ followers on Twitter. As far as I can figure, he & his supporters specifically have raised upwards of $125,000 for Democratic candidates via my "Endgame" links so far (it didn't occur to me to provide him with the referral code tag to use until he had already been sharing the links for several days; as far as I can figure they had already raised around $110,000 up until that point...roughly $100K for U.S. House races & another $10K for state legislative races).
While the chart above may make it seem as though the social media posts aren't that effective, it's important to remember that a) again, I sometimes forget to include referral codes myself when posting to social media, and b) many people who show up as donating via the links here at Blue24.org found that link via my posts on Twitter, Blue Sky, Threads etc.
It's also important to note that the link to my POTUS page went viral right after President Biden endorsed VP Harris, almost certainly due to someone with a lot of followers tweeting it out directly to several million followers. I have no idea who it was, but I'm eternally grateful!